Description
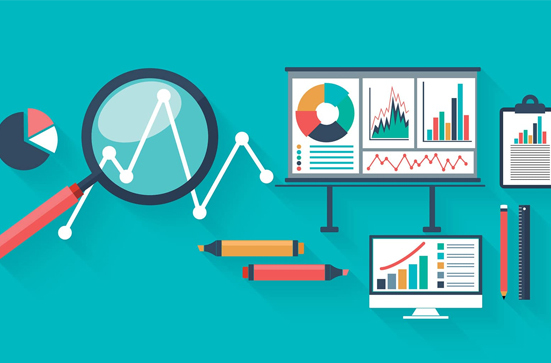
This course will introduce you to the fundamentals of data analytics, the process of collecting, cleaning, analyzing, and communicating data to support data-driven decision making. You will learn how to use various statistical methods and tools to handle different types of data, such as univariate, bivariate, and multivariate data. You will also learn how to create effective data visualizations and dashboards to communicate your insights and recommendations.
Objectives
- Explain the concepts and steps of data analytics
- Differentiate between univariate, bivariate, and multivariate data and analysis
- Identify and evaluate data sources and quality
- Perform data manipulation and analysis using spreadsheets
- Apply statistical techniques to summarize, test, and compare data
- Apply the use of the Powerful Python programming launguage for Data Analysis and Visualisation
- Create data visualizations and dashboards using Tableau and/or PowerBI
- Communicate data insights and recommendations to stakeholders
Delivery: Online – Weekdays & Weekends
Duration: 4 Months
Prerequisites
Course Content
Expand All
Module Content
0% Complete
0/6 Steps
Module Content
0% Complete
0/2 Steps
Module Content
0% Complete
0/5 Steps


